Oh, interesting. I also ass-umed that Dart compiles to native code.
Yes, it does, when built in release mode.
Notice that native code is one thing. Running it is another.
Comparing Dart with C: in C, you need to include stdio.h to use standard I/O, right? All languages, aside from low-level ones, needs also some kind of support for doing things, such as I/O. Usually, languages have what is called runtime: a piece of code that is embedded in every binary that allows your Dart code (which IS native) to actually call the OS native calls to, let’s say, open a file. ALL languages that are higher level than C has a runtime. So, yes, Dart IS compiled to machine language code, but you need a bit of abstraction to make this code work in the target platform (the runtime).
Which would make hot reload rather difficult
When running Flutter in debug mode, it is actually JITted (there is a compiler inside the debug client that will get Dart code and compile it to run on demand - that’s what Just In Time means. Notice that Apple doesn’t allow that (and it’s kinda slow, especially on mobile devices), so Dart compiles full AOT in release time, to actual X64 and ARM code.
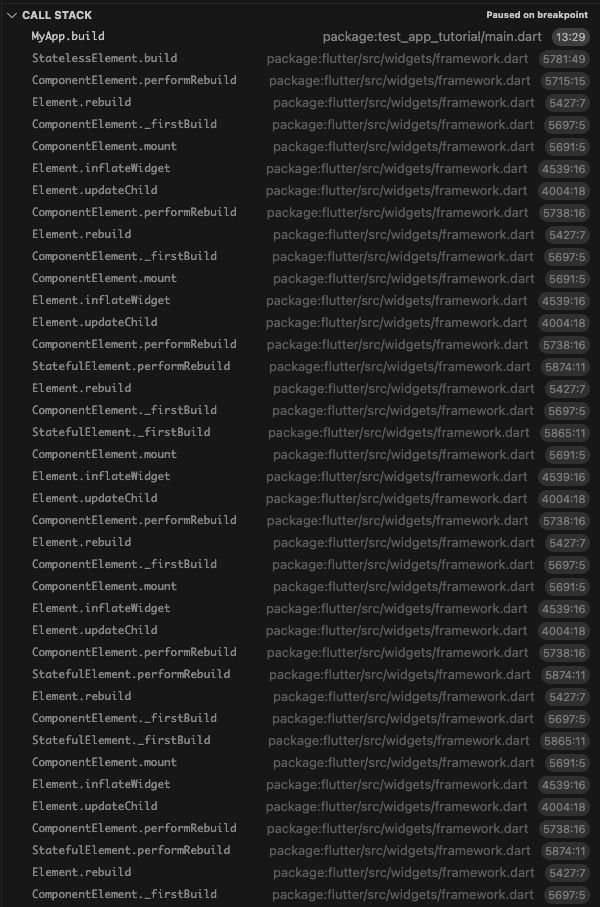
This doesn’t actually explain why the call stack cycles back on itself and repeats infinitely, as far as I looked
Isn’t that the explanation of an infinite loop?
Imagine this: you are animating the color of a text from green to red. That animation will have a total duration of 2 seconds. Imagine you are on a phone with a 120Hz display. Your build method (should) will be called 120 x 2 times (120 calls a second, for 2 seconds). In each call your build method will update the text color. So that stack trace makes sense now, right? You are doing something that is triggering thousands of build calls. That’s the whole normal Flutter stack trace (it’s an infinite loop).
Even an interpreted language has a stack
As does Dart. But Flutter makes kinda useless to track, since it is very verbose.
I don’t know exactly what your intention is with the stack trace, if you could say what you want, I maybe can explain it better. If it is only for understanding, then understand this: Dart is a language (that have a normal stack trace, as you are used to). Flutter is a SDK, a Framework that does (heavy) stuff, so its stack trace is insane. Is exactly the same thing to analyse the stack of a running Doom game =P
in which it tries to service pending events,
It is exactly this. All event loop languages are this: an infinite loop that triggers and consumes events. If you are familiar with, Windows also works this way. Read this: Event Loop — Flutter. Dart uses an event-driven programming… | by Gaurav Swarankar | Medium You can add things to that event loop using SchedulerBinder, scheduleMicrotask, etc. async, in this case is: let someone else do this stuff and let continue the loop, whenever that response arrive, insert in the event so, eventually, the loop will get back to it. It’s NOT like, let’s say, C# Task (that can be either a continuation I/O, like I described, or a real thread… There is no such thing as threads in Dart).
so my stepping in the debugger while trying to study the behavior caused this
It depends how you are stepping. Sometimes, yes, you enter the Flutter framework and it is impossible to get out of there =( I come from a .net world where the debugger is perfect and I can trace the whole stack the way you probably are used to. In Dart this is also true, but Flutter gets in the way =\
when you hit a breakpoint without interrupts locked
Wonderful! Then you’ll understand this. Sometimes, Flutter acts like this: an interrupt that fucks up your debug =) Sometime you will hit the main loop and you will never be able to get out of there using the step in debug function =) The point is: you should NOT be there. Something you did make you get there (maybe you trace too deep or you are in a point where an exception occurred inside Flutter itself and you’ll get back there). But it’s rare. I often don’t have trouble with the step in while stepping in my code only. Flutter/Dart/VSCode plugin really should have an option to NOT step in non-user code (as C# has) =\
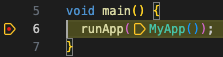
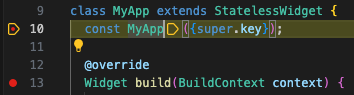
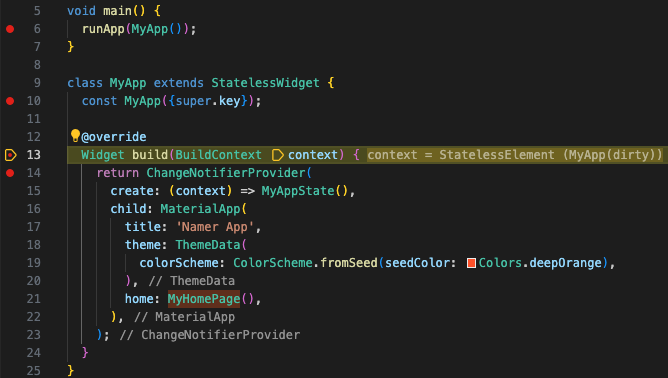
EDIT: To be clear: there are TWO infinite loops here: one is the Dart event loop (that article), other is the Flutter loop that keeps triggering widgets build methods, renderers render methods, etc. The screenshot you posted is the second one: the Flutter loop is building the MyApp, which will trigger ALL build methods for ALL children widgets. And a lot of things will retrigger this: hot restart, a widget changing something, a theme change, etc. So, don’t mess with the build method. That method is meant only for updating your widget state and nothing else (remember: in an animation, all those hundreds of build methods will run 120 times a second!).