What's your logging strategy?

As a kind of follow up to Tips on making Dart & Flutter projects more easily debuggable, I’d like to ask everyone about how exactly they log in their production projects.

Which library do you use? When and how do you set up the main logger instance? How do you inject the logger into the rest of your app? How do you output the logs? Which service(s) do you use to get a hold of the logs from your users?


To kick things out, I’ll start with what I’m currently doing in GIANT ROBOT GAME. (This one’s a bit specific in that it’s mainly a desktop project, and a game, so take it with a healthy grain of salt.)

  • I just use the barebones pkg:logging.

  • I have a template set up in intellij for quickly adding a logger to any class. I just write logger and it’ll write something like static final Logger _log = Logger('WeaponPart');. That way I don’t introduce basically any dependency, I don’t need to inject stuff, etc.

  • I log at all levels between finest and severe. I try to log pretty extensively and often use if statements with logs instead of asserts so that things are caught even in production.

  • For logs with levels warning and above, I try my best to include stacktrace (so that it’s easier for me to debug). For example:

    if (startingTile == null) {
     _log.warning('Trying to compute traversed tiles from outside the map',
         ArgumentError('$origin out of bounds', 'origin'), StackTrace.current);
     return;
    }
    
  • I have the game set up so that the in-game console opens up any time a log with the level warning or above opens when debugging. That way, I’m always aware when things go awry.

    console-grg

  • In production, warnings are merely reported via Sentry but don’t open the in-game console. The in-game console gets open only on log messages I tag as severe.

  • In main, I have the following code (I’m adding some additional explanatory line comments with // *):

Future<void> main() async {
  if (kDebugMode) {
    debugPrint("WARNING: Sentry is disabled because we're in debug mode. "
        "Sentry functionality (such as sending feedback) will fail silently.");
    await _guardedMain();
    return;
  }

  await SentryFlutter.init(
    (options) {
      options.dsn = '...';

      if (const bool.hasEnvironment('devName')) {
        // Run with --dart-define=devName=yourname in debug mode.
        const devName = String.fromEnvironment('devName');
        options.environment = 'debug-$devName';
        debugPrint(options.environment);
      }

      options.release = 'giant_robot@$appVersion+$appVersionLabel';  // *So, in sentry, I get something like "giant_robot@0.25+55+Xenotech". The version label helps me more easily distinguish one version from another.

      options.beforeSend = (event, hint) {
        if (hint.get('isPlayerFeedback') == true) {
          // Keep different player feedback separated (prevent sentry from
          // grouping them together).
          event = event.copyWith(
            fingerprint: [
              '{{ default }}',
              hint.get('feedbackText').toString(),
            ],
          );
        }
        return event;
      };
    },
    appRunner: _guardedMain,
  );
}

/// The initialization code that would normally be in [main]
/// but it's wrapped with [SentryFlutter.init] for error reporting.
Future<void> _guardedMain() async {
  final log = Logger('_guardedMain');

  // Needed for `package:path_provider` to work, which in turn is needed
  // for [IoFileLogger] to work.
  WidgetsFlutterBinding.ensureInitialized();

  final FileLogger fileLogger;  // *On desktop, it's a good idea to keep your own log file somewhere.
  if (kIsWeb) {
    fileLogger = FileLogger.noOp();
  } else {
    fileLogger = IoFileLogger();
  }
  await fileLogger.initialize();

  Logger.root.level = Level.FINE; // *Defaults to Level.INFO, but at least at this stage, I want the Level.FINE logs, too.
  Logger.root.onRecord.listen((record) {
    dev.log(
      record.message,
      time: record.time,
      level: record.level.value,
      name: record.loggerName,
      error: record.error,
      stackTrace: record.stackTrace,
    );

    final logLevelTag = '[${record.level.name}]';
    fileLogger.writeln('${record.time.toIso8601String()} '
        '${logLevelTag.padLeft(9)} '
        '<${record.loggerName}> '
        '${record.message}');
    if (record.error != null || record.stackTrace != null) {
      fileLogger.writeln('[ERROR]: ${record.error}');
      fileLogger.writeln('[STACKTRACE]: ${record.stackTrace}');
    }

    // Add the log to Sentry so that we have that context in case of an error.
    Sentry.addBreadcrumb(
      Breadcrumb(
        message: record.message,
        timestamp: record.time.toUtc(),
        category: record.loggerName,
        level: switch (record.level) {
          Level.ALL => SentryLevel.debug,
          Level.FINEST => SentryLevel.debug,
          Level.FINER => SentryLevel.debug,
          Level.FINE => SentryLevel.debug,
          Level.CONFIG => SentryLevel.debug,
          Level.INFO => SentryLevel.info,
          Level.WARNING => SentryLevel.warning,
          Level.SEVERE => SentryLevel.error,
          Level.SHOUT => SentryLevel.fatal,
          Level.OFF => SentryLevel.info,
          _ => SentryLevel.warning,
        },
      ),
    );

    if (record.level >= Level.WARNING) {
      Sentry.captureException(_ExceptionFromLog(record),
          stackTrace: record.stackTrace);
    }
  });

  // The in-game console which can be opened by hitting `/` (slash).
  // It starts listening to log messages as soon as it's created.
  final console = Console();

  // We need to wait until after Console is created so that the message
  // makes it into the console log.
  log.info(() => 'Logging to $fileLogger.');

  ... // *Other initialization, now logged.

  runApp( ... );
}


For the record, I don’t think this is the best approach and I don’t even think this is a particularly good approach. It’s been very helpful so far but I’m looking for improvements and other ideas.
8 Likes

I use logger as well because it has a Stream I can listen to.

That allows me to turn on remote log using MQTT for a specific user (for example: a user is complaining about some bug, I can get her e-mail and then turn on remote log for her account only, which will start to dump logger stream to a MQTT channel, which is then displayed in a console app I built, so I can see the logs in real time as the user is interacting with the app). It helps a lot since, “it always works on my machines (C)”, but not in customers’ machines.

I was thinking (but not implemented yet) to keep a file with the last N lines of log and then send this log to my backend whenever an error occurs in Flutter (which will trigger the Firebase Crashlytics). I have the log listener and I have the Firebase Crashlytics handler. The only missing piece of technology are time and lack of lazyness.

4 Likes

Very interesting topic!

I think my current setup is quite similar to yours at its crux with some helpers that are self explanatory from its names

/// ERROR and WARNING always go to server on release mode.
/// INFO logs only go to server if [_logOverride] is true.
static void _initAppLogger() {
    logger.level = Level.ALL;
    logger.onRecord.listen((logRecord) {
      // All logs (at minimum) always get printed to console on non-prod builds.
      // Format it the way we want to see it in our console
      final message = _formatLogForConsole(logRecord);

      final stackTrace = logRecord.stackTracePlus;
      // It's called error, but we can pass it anything
      final Object? logObject = logRecord.error;

      String objectToAppend = '';

      // If log logRecord.error is instance of LogAttributes, then format it as json
      // and assign new variable with it assigned to message
      if (logObject is LogAttributes) {
        final logObjectJson = logObject.toString();
        final logObjectJsonFormatted = logObjectJson
            .replaceAll('{', '{\n')
            .replaceAll('}', '\n}')
            .replaceAll(',', ',\n');
        objectToAppend = '\n$logObjectJsonFormatted';
      } else if (logObject != null) {
        objectToAppend = '\n$logObject';
      }

      final messageToLog = '$message'
          '$objectToAppend'
          '${stackTrace != null ? '\n$stackTrace' : ''}';

      // This will only log on non-prod (if not overridden)
      _logPrint(logRecord.level, messageToLog);

      if (!observabilityServicesEnabled || shouldSuppressLog(logRecord)) {
        return;
      }
      _logRecordTracker.recordReport(logRecord.message);
      _sendLogToSentry(logRecord);
      _sendLogToDataDog(logRecord);
    });
  }

A few interesting bits:

  • shouldSuppressLog does rate limiting on a per log/error level and also handles the log level logic. There’s also a class of logs that just pollute the logs that we specifically filter out here
  • Loggers with context
static Logger withName(String name) {
   return Logger('$_appLoggerName.$name');
 }
  • This is especially powerful combined with something like this that’s in our base ViewModel class among other places
Logger get log => AppLogger.withName(runtimeType.toString());
  • _logOverride is a firebase remote config driven , locally cached variable that is enabled for staff users, and selectively enabled for specific users that are facing issues we have a difficult time debugging
3 Likes

Yes, this is the Breadcrumbs piece of code above, and it has been really helpful. For every incident, you get a timeline of previous logs and events. This is the main reason why I log Level.FINE even in production.

Thanks for sharing!

One questino: is LogAttributes a class coming from a package or your own custom thing?

Its just a Json Object Type. We use it to ensure type consistency
typedef LogAttributes = Map<String, dynamic>;

Edit: Added Reply

1 Like

I also use the logging package, and I also have template to create logs by classes like but I create a static one, as all classes could share the same logger.

That being said my logging solution is bit different than yours.

I have configured my logger to generate a message that includes the log level, time, message and object annexed.

Then I use the logging package to direct my logs to Sentry and DataDog.

Sentry is good for crashes, and info level logs will be added to crashes, but you can’t know what’s happening inside your apps if you don’t have a crash. This is where DataDog shines, you can see in real-time all logs as they come, info and all.

From severe and up I generate an error in Sentry, and less than that I add as info. So in a practical sense, I only log for these 2 levels to be honest, but nothing would stop me from using more levels.

I filter my logs before sending them so if I am running from a Debug build I don’t send the logs, this avoids my development time errors from sending alarms.

This is a simplified version of my logging solution, there’s more to it, like how I configure Sentry and DataDog, how I direct all exceptions that escaped from my zone, how I suppress prints in release builds, etc.

1 Like

Hey there!
Just a comment on your approach
Instead of manually manipulating a JSON string, you could use JsonEncoder.withIndent:

// Example from:
// https://api.flutter.dev/flutter/dart-convert/JsonEncoder-class.html
const JsonEncoder encoder = JsonEncoder.withIndent('  ');

const data = {'text': 'foo', 'value': '2'};
final String jsonString = encoder.convert(data);
print(jsonString);
// {
//   "text": "foo",
//   "value": "2"
// }
3 Likes

Oh interesting, thank you!

We need to collect logs from several places:

  • flutter app
  • background jobs in Flutter started via workmanager (separate Flutter engine)
  • Android foreground service
  • iOS native app with bluetooth state restoration
  • iOS home screen widgets
  • backend cloud functions

Over the past 2 years we landed on a combination of custom implementation of:

  • pkg:logger with outputs varying between modes (file, remote, console)
  • CocoaLumberjack on iOS
  • and custom android Logger that depending on the mode uses logcat or BufferedWriter
  • cloud functions go to GCP Logging

One thing I’m still switching between is the remote logger tool. We rely on logs a lot, and we generate them at quite a big scale. Tools like Bugfender, Crashlytics (with export to BigQuery), Sentry didn’t work well for us. Currently we often just open the log files in plain text and use variety of tools to filter and merge necessary traces, but would like to make it a bit more organized. I built a tool to send our logs to Google Cloud Logging, but this interface also gets sometimes a bit clunky as it’s never been built to support thousands of daily users across multiple devices.

I’m wondering where do you send and read your remote logs?

3 Likes

Not for me to answer but: Being a fan of Serilog (https://serilog.net/), my logs are structured (in JSON, since Dart doesn’t have String templates), so I can dump them on a database engine, index properties, etc. MongoDB capped collections are very nice for it.

BTW, I don’t use Cloud stuff… (in a world where Authentication would cost me USD 7000/month, I prefer to host my own things), but there are cheap log managers out there (such as https://axiom.co/). I’m just not sure how they handle (if all) structured logs.

Currently, I’m not getting logs unless they lead to a warning or a severe log. (Then I get them via Sentry’s breadcrumbs feature.)

Now I’m wondering how much I’m missing out. I can imagine logs being useful for, say, usage analytics. But are non-fatal logs (not connected to any failure) useful for bug hunting?

Since I use Mediator Pattern, it is very useful. I know which handlers were executed and in which order, so I know what the user was doing. I can even recreate those steps on tests.

I’m using this package: streamline | Flutter package

It has a widget that watches events and then triggers CQRS queries to fetch data, so tracking the events dispatched along with which queries were executed allow my team to know exactly what is going on (and for free we get a Firebase Performance for EACH query and command, since that package has support for pipelines). Knowing which part of your business logic takes X ms is a must :heart_eyes:

1 Like

Hey, sorry I’m jumping into this thread a bit late. I sometimes forget this forum exists until I get an interesting email. :slight_smile:

Logging is one of the key pillars of my arcane_framework package, which I developed to give a standard way of handling common tasks across the multitude of applications I work on. Here’s how logging works in Arcane:

First thing’s first, I will write one (or more) logging interfaces. (In practice, these get recycled from project to project, and I might end up creating a package for the interfaces I commonly use…). A logging interface is a singleton class, where the most barebones one might look like this:

import "package:arcane_framework/arcane_framework.dart";
import "package:flutter/foundation.dart";

class DebugPrint implements LoggingInterface {
  DebugPrint._internal();
  static final DebugPrint _instance = DebugPrint._internal();
  static DebugPrint get I => _instance;

  @override
  bool get initialized => true;

  @override
  void log(
    String message, {
    Map<String, dynamic>? metadata,
    Level? level = Level.debug,
    StackTrace? stackTrace,
    Object? extra,
  }) {
    debugPrint("[${level!.name}] $message ($metadata)");
  }

  @override
  Future<LoggingInterface?> init() async => I;
}

(Here’s an interface I actually use in almost all of my projects. Note that I can toggle logging on/off using Arcane’s feature flag system, which can even be modified at runtime using something like Firebase’s A/B testing as an example.)

Once I have my interface(s) written, I need to register them in Arcane:

  await Arcane.logger.registerInterfaces([
    DebugConsole.I,
    NewRelic.I,
  ]);

  await Arcane.logger.initializeInterfaces();

Ensuring that the interfaces are singleton instances allows me to do things like initialize them (for example, the above New Relic interface would need to be initialized before logging to it.) The practical upshot of this is that I can begin logging to my debug console immediately but defer external logging until after I’ve confirmed app tracking permissions (which I generally don’t like to do until after the user has logged in or is about to sign up, etc… why hit them with a tracking request the second they install and open my app for the first time?)

Another neat thing that using Arcane unlocks in logging is the ability to add persistent metadata. For example, I like to track the same app install over multiple sessions without explicitly exposing any PII. To do this, I create an ArcaneService that provides a UUID for both the session and installation, where the installation ID is kept in persistent storage and used across app launches. Here’s what this looks like:

  final String? installId = IdService.I.installId;

  // This is a `ValueListenable<String?>`, in case the user
  // logs out and I want to reset it.
  final String? sessionId = IdService.I.sessionId.value;

  // Add metadata to the logger
  Arcane.logger.addPersistentMetadata({
    "installation_id": installId,
    "session_id": sessionId,
  });

Once that small amount of setup work is done, logging is super simple and powerful. The simplest log message would be:

Arcane.log("Just a simple test message");

This would produce a log with a logging level of Level.debug and send it to all of your registered interfaces. Each interface would decide what to do with it from there.

However, there are many more options available to us with Arcane.log():

  Arcane.log(
    "Advanced logging example",

    // Sets the logging level
    level: kDebugMode ? Level.debug : Level.fatal,
   
    // Normally, this is autodetected as the class where the log message is called.
    // It's not perfect and sometimes needs to be overridden.
    module: "main",

    // Normally, this is autodetected as the method from which the log message is
    // generated, however it sometimes doesn't detect properly and can therefore
    // be overridden, just like the module.
    method: "init",

    // This gets passed to your interface and can be useful when things go wrong.
    stackTrace: stacktrace,

    // You can pass _any_ extra data for processing to your interfaces. It doesn't
    // matter what it is or how you use it. Freedom!
    extra: object,

    // Any metadata added to your log message will be merged with the persistent
    // metadata that you've registered in Arcane.
    metadata: {
      "hello": "world",
    },
  );

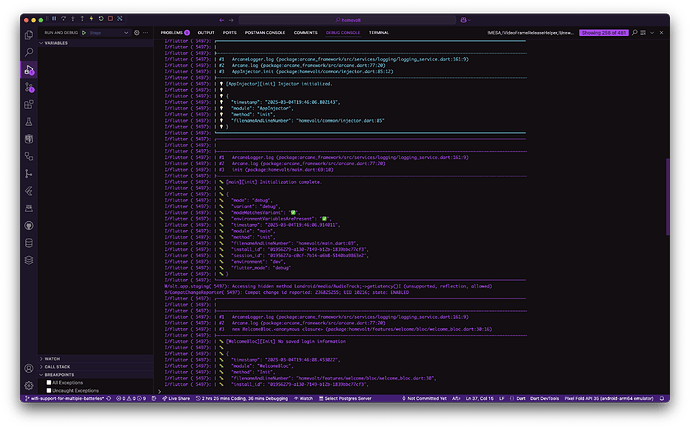
I’ve been using this system for logging for a few years now, slowly refining it as I go. It’s gotten to the point where I’m able to add a quick log message, toss in some variables to the metadata, and have a pretty complete picture of the lifecycle of my application while I’m developing:

Since the original question wasn’t just “what do you use to log” and also “where do you log?” as well as “what do you log?”, let me answer those questions quickly as well:

Where do you log?

Well, for starters, I keep my debug console open while my app is running as I’m developing it. I have a lot of screen real estate, so it makes sense to quickly catch things. In production, I’ve used NewRelic, Datadog, and Sentry. Of them, I’ve preferred Datadog and Sentry, although I think they come with a higher pricetag.

Although I haven’t written an interface to do it myself, I do quite like that MQTT suggestion… and I might actually give that a shot, since I’ve got a MQTT server running at home. If that works out, I think it could be a game-changer. It’s an excellent suggestion.

Otherwise, as silly as it sounds, you could pretty easily set up an interface to talk to a remote syslog server. There are an infinite number of tools that would consume the logs from there…

What do you log?

It depends on the application and who I’m writing it for. I find that it’s useful to log, at a minimum, the following general categories of things:

  • User interactions (tapping a button, navigating, toggling a toggle, etc.) This is useful to understand how your app is being used. Analytics and all that.
  • When the UI makes a request to my bloc (see above point)
  • When the bloc receives an event
  • When the bloc asks the API/repository to fulfill a request
  • When my API/repository receives a request and the outcome of said request
  • When a response is returned to my bloc from the API/repository
  • When a state is emitted from my bloc

This gives a pretty wholistic overview of a) what the user did, b) how the state changed in response, and c) what happened (or didn’t) between the user performing an action and the display being updated.

I think this post has gone on long enough but I hope it helps answer your question and provides any amount of useful information to somebody else out there. Feel free to reach out/reply with questions and let me know if you have seen/heard of/used arcane_framework before, or if you decide to check it out.

  • Hans
2 Likes

Check out datadog. In a similar situation where we had a lot of logs, that was the best imo. They have a ton of features but I didnt use any of those just the logging, and then you can create various custom alerts/ filters from there

That’s a fantastic reply, @hanskokx, thanks!

I have a question: how do you autodetect the method and the class?

This is a fantastic list!

P.S.: Don’t ever worry about replying “late” to a thread here. This is a forum, not a social network, so the pace is supposed to be slower.

@filip Detecting the method and class is a bit of a messy hack job and one of the places where I’d like to spend a bit more time improving the code (as it often throws silent exceptions in its current incarnation). The relevant code can be found here:

      final List<String> parts = StackTrace.current
          .toString()
          .split("\n")[2]
          .split(RegExp("#2"))[1]
          .trimLeft()
          .split(".");

      module ??= parts.first.replaceFirst("new ", "");
      method ??= parts[1].split(" ").first.replaceAll("<anonymous", "");

      final List<String> fileAndLineParts = StackTrace.current
          .toString()
          .split("\n")[2]
          .split(RegExp("#2"))[1]
          .trim()
          .split("(package:")
          .last
          .split(":");

      final String fileAndLine =
          "${fileAndLineParts[0]}:${fileAndLineParts[1]}";

      metadata.putIfAbsent("module", () => module!);
      if (method.isNotNullOrEmpty)
        metadata.putIfAbsent("method", () => method!);
      metadata.putIfAbsent("filenameAndLineNumber", () => fileAndLine);

Thanks for sharing that! I suspected StackTrace.current to be used — couldn’t imagine another way.

This might not be an issue in your case, but I’d be worried about performance implications of having StackTrace.current calls in so many places (through calls to log). I think it means that Dart has to be more conservative about some optimizations — but I can’t be sure.

This is a separate discussion, but if you ever have a chance to benchmark the log call with and without the StackTrace.current call, I’d be very interested. The actual effect might be miniscule or simply non-existent.

1 Like
Future<void> main() async {
  await initSentry();
  runApp(SentryWidget(child: MyApp()));
  }

  Future<void> initSentry() async {
  try {
    await SentryFlutter.init(
      (options) {
        options.environment = "dev";
        options.tracesSampleRate = 0.1;
        options.dsn ='your_dsn_value';
      },
    );
  } catch (exception, stackTrace) {
    print('Failed to init Sentry: $exception');
    print(stackTrace);
  }
  }

Future<void> toggleSentry(bool enable) async{
  try{
  if(enable){
    await initSentry();
  }else{
    await Sentry.close();
  }
}catch (exception, stackTrace) {
    print('Failed to toggle Sentry: $exception');
    print(stackTrace);
  }
}

I am wondering whether this would work, instead of passing in appRunner

We have a mixin that returns a logging service (registered in get_it). This logging service is basically wrapper around loggy package, and also adds StackTrace.current etc.

We register one loggy printer which then redirects log event to our printers (or keys handler for crashlytics, that is specific to app), otherwise its shared between our apps. We have our printers for stuff like console, crashlytics, bugfender, seq. These printers are added based on app enviroment (flavor, mode, etc.) on startup.

Works well, I jsut add AppLogger mixin to any class, or use AppLogger.instance for static access.

Some of our printers require facade to be provided. For example CrashlyticsPrinter has all the message parsing etc. that can be made reusable across apps with no dependency on firebase, and the facate it requires then implements passing the message to firebase instance etc.

This way we can really minimize settings on app side and maximalize common settings on shared-package side.


basically this

class MyClass with AppLoggy {
  void someMethod() {
    logger.info('Some log message');
    AppLogger.instance.info('Some log message');
  }
}
1 Like